The 80/20 rule is a key quantitative foundation of responsible management. Stated Simply: The top 80% of the results are derived from the best 20% of available opportunities.
Take a quick tour of your house or apartment and look at the floor. The wear & tear, the spots that need frequent cleaning, the wear path is on about 20% of the surface area of the floor. The rest of your floor — the vast majority of it — sees very little wear at all.
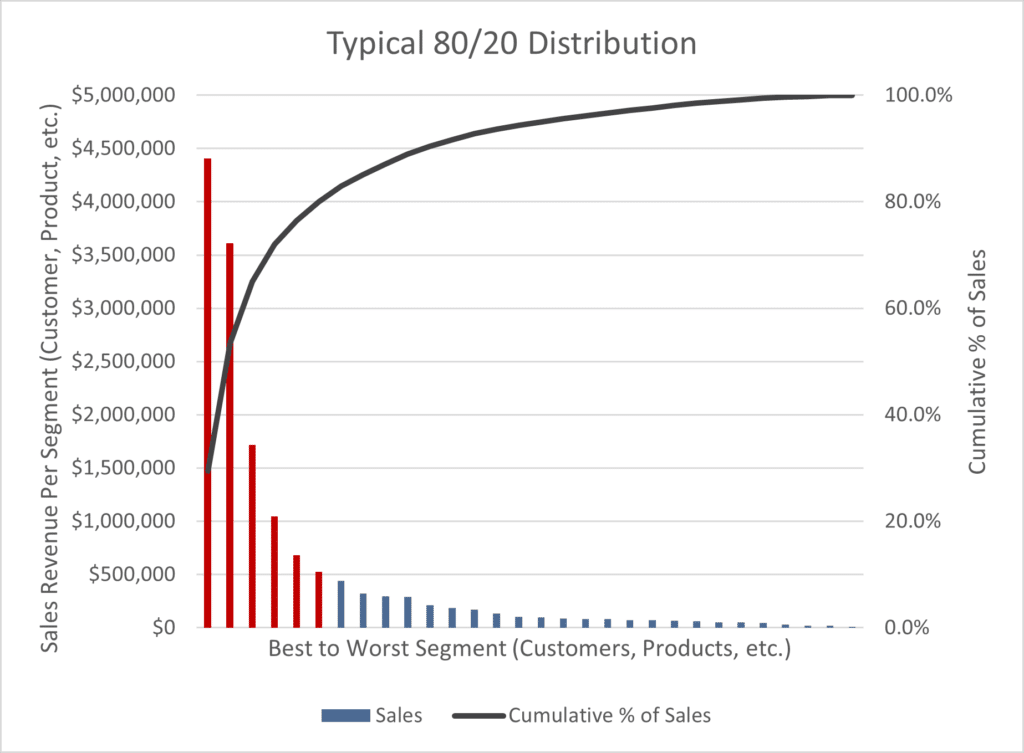
Let’s pivot towards a business. If you plot sales of a given segment (typically customer or product) in decreasing order, you’ll get a plot that looks something like this:

This plot has 30 opportunities within the segment. Notice that 80% of the total revenue is derived from the top 20% of the opportunities (20% of 30 is 6). Those six best opportunities are colored red.
Why is the dividing line of 80% vs. 20% so important?
There is critical mass among those top opportunities to fund your business and generate a return on investment. Once you get past 80% or so, the law of diminishing returns arises. The returns generated to support that less important business quickly become unworthy of investment.
Like any business practice, there is some commonly used vocabulary including:
| The 80 | The top 80% of revenue generated by the top 20% of opportunities. This is a smaller list with more more revenue with each opportunity. |
| The 20 | The bottom 20% of revenue generated by the remaining 80% of opportunities. This is a much longer list with very little revenue with each opportunity. |
| Pareto or Pareto Analysis | Table or plot of revenue vs. opportunity in decreasing order. Named after economist Vilfredo Pareto who first noticed the pattern. |
| 80/20 | Catchall term for the toolkit used by those who use the 80/20 as a lens. |
A word about where these numbers came from:
I have seen this pattern time and time again, but I’m far from the first. Economist Vilfredo Pareto uncovered this relationship in 1906.
The 80/20 rule is a real world example of the broader power law in statistics.
Key Takeaways:
- The 80/20 rule is the observation that in a population, the top 80% of results are generated by the top 20% of contributors.
- To discover “the 80” (i.e. the critical fiew things that generate the majority of returns), use these steps:
- Rank the population-of-things in decreasing order,
- Calculate the percent contribution of each
- Take a running total of that percentage.
- The cutoff at 80% cumulative should be at approximately the 20% cutoff line.