A quadrant analysis is dividing your business into 80 or 20 customers vs. 80 or 20 products. This analysis provides powerful insights into the overall health of your business.
Here are the steps to creating a Quadrant Analysis
- Start with a representative set of sales data. Typically one to three years. It needs to be at the transaction level. Each record should have one and only one SKU, one and only one customer. Dollars and quantities will of course, vary.
- Sum up and rank in decreasing order (by sales) customer. Assign the label “80” to those top few customers who contribute 80% in revenue. This should be approximately your best 20% of customers. Microsoft Excel users often use a pivot table.
- Do the same for product. Your best 20% or so of products will deliver 80% of sales revenue.
- Go back to your source data in step 1. For each line of transaction, you want to know if it’s an 80 vs. 20 Customer, and 80 vs. 20 Product. Microsoft Excel users often use the =VLOOKUP function.
- Create pivot table. The cell data will have sales dollars at a minimum. The column label will be 80 vs 20 Products. The row label will be 80 vs. 20 Customers. The output of this analysis should look something like this:
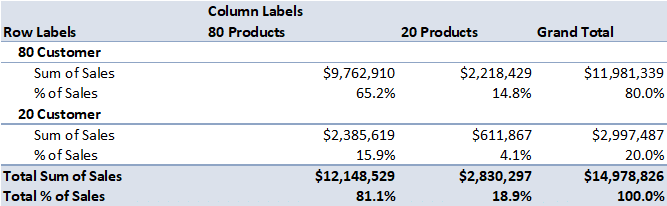
What this Quadrant Analysis Tells You
- In the sample data I’ve created above, the intersection of the best customers and best products is 65% of sales revenue. $9.8M on a basis of a $15M business.
- The worst customers buying the worst products accounts for 4% of your business. $2.8 M over $15M.
- You can (and should) include other drivers like Number of SKUs, Gross Profit, Number of Customers, Number of Transactions, etc. For the purposes of this blog post, we’re keeping it simple by looking only at sales and % of sales.
- The next question is “okay, what do I do with these data?”
- Sneak Peak 1: If you include COGS (driven by variable costs) in the above chart (a good thing), where… exactly… are the fixed costs getting buried?
- Sneak Peak 2: Only 1 of these quadrants is helping your business.
Key Takeaways:
- A quadrant analysis quantifies every transaction on both the customer and product level. 80 vs. 20 customer on the vertical axis, and 80 vs. 20 product on the horizontal axis, for a total of four possible quadrants.
- The size & scope of each of those quadrants tells you the overall health of your business.